

 JBizNews
World Cup Ticket Prices Are Approaching Monthly Housing Costs in U.S. Host Cities

With the 2026 FIFA World Cup making headlines, a recent PropertyShark market study revealed that in five of the 11 hosting cities, the cheapest available ticket for the most expensive game is now on par with – or above – a full month of rent or mortgage payments. Even at the low end, seats for many of the most anticipated matches already translate into a significant share of a typical household’s monthly housing cost.
The PropertyShark study analyzed the lowest available ticket price for each city’s most expensive group-stage match and priciest overall match (at the time of the publication). The analysis compared that against the local average rent and estimated monthly mortgage payment. Mortgage estimates were based on local median sale prices using a 30-year mortgage at 6.5% interest with 20% down payment and rental figures were provided by RentCafe.
Ticket prices remain subject to dynamic pricing and resale-market shifts and the exact figures presented in this study were applicable at the original time of the publication, June 4.
Five Host Cities Already Reach the One-Month Housing Costs Threshold
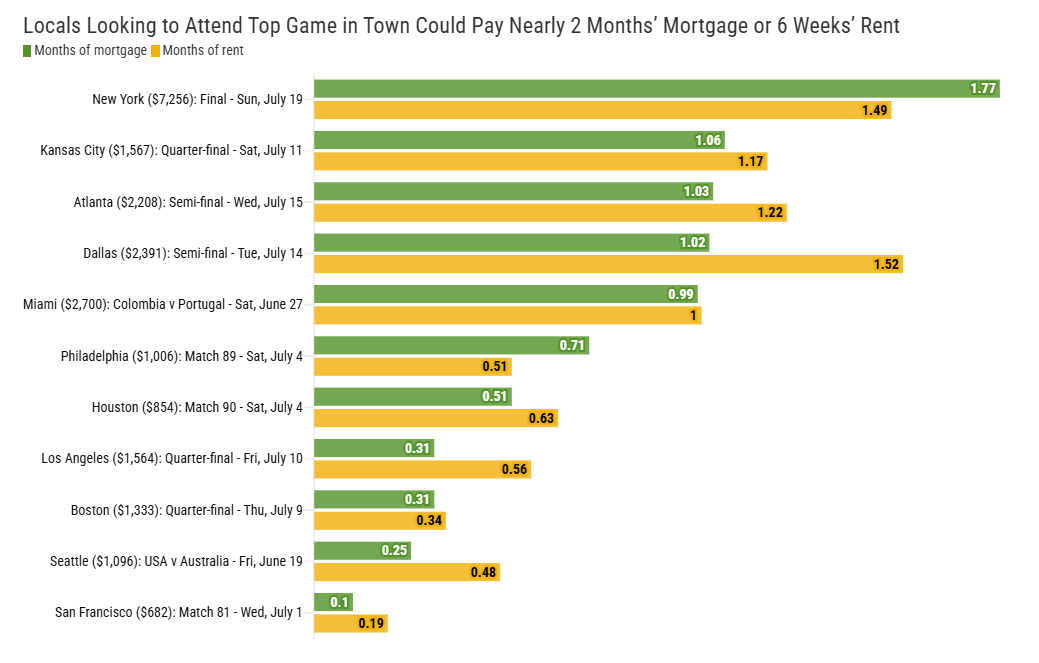
The broad takeaway is straightforward: In five of the 11 U.S. host cities, the cheapest ticket to the most expensive local match costs at least as much as one month of rent or mortgage, with New York City standing out the most. At current pricing, the least expensive ticket to the World Cup final would cover more than six weeks of average rent in the city and nearly two months of average mortgage payments.
Even before the knockout rounds, the numbers are substantial. In eight of the 11 host cities, the cheapest ticket to a top-priced group-stage match already represented at least 10 days of rent or about one week of mortgage expense. In other words, the affordability gap is not limited to the final rounds of the tournament.
Pricing Highlights in the 11 U.S. Host Cities

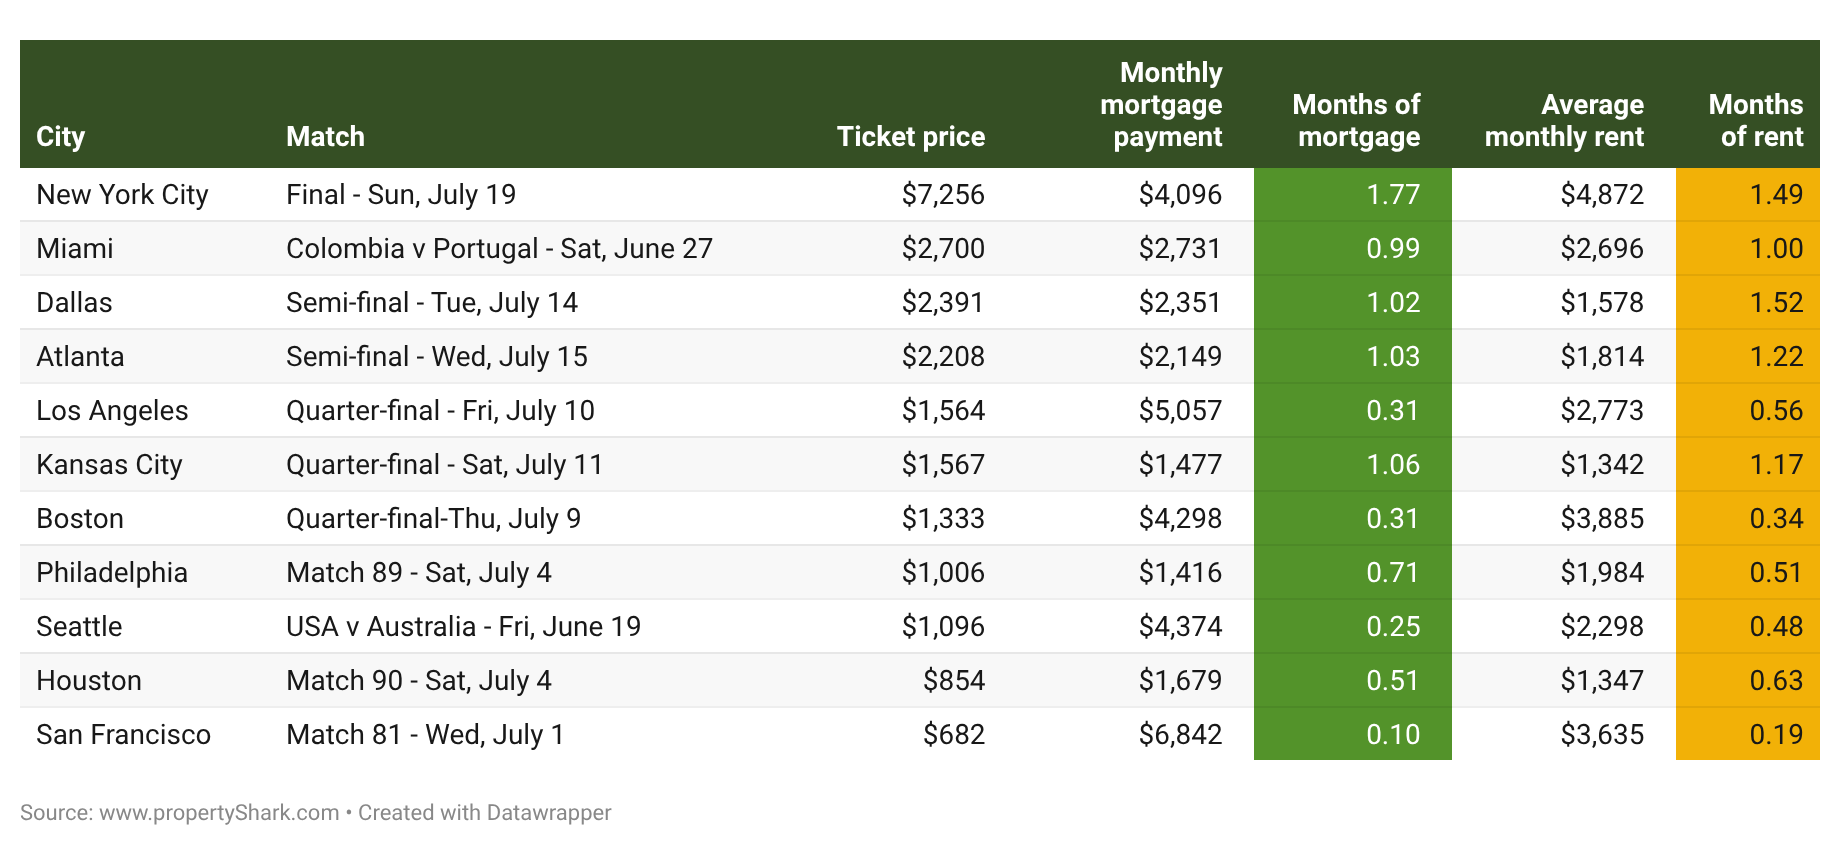
New York City displays the most extreme comparison. The cheapest ticket to the July 19 final is $7,256, while average monthly mortgage and rent costs stand at $4,096 and $4,872, respectively. This is the equivalent of six weeks of rent costs or nearly two months of mortgage payments. Even a major group-stage match such as Brazil versus Morocco cost $1,465 or about one-third of a month’s housing costs.

Miami also showed one of the most striking examples. The Colombia-Portugal match is priced at $2,700, compared with an average monthly mortgage payment of $2,731 and average rent of $2,696. Even Scotland versus Brazil, a more typical group-stage match, was priced at $1,673 or more than half a month of housing costs.

In Dallas, the Argentina versus Austria match carried a $1,096 entry point, nearly three weeks of rent (at a $1,578 average rent) and close to half a mortgage payment (set against a $465,000 median sale price). The July 14 semi-final rises to $2,391, effectively matching a full month’s mortgage or six weeks of rent.

Atlanta’s group-stage prices are less severe, but its semi-final is not. The most affordable ticket to Spain versus Saudi Arabia cost $653, roughly one-third of a month’s rent or mortgage. Meanwhile, the July 15 semi-final is priced at $2,208, equivalent to around one month of mortgage or roughly five weeks of rent.

In Los Angeles, a USA versus Paraguay ticket started at a $905 minimum, equal to about 10 days of rent or one-fifth of a monthly mortgage. The July 10 quarterfinal rises to $1,564 or roughly one-third of a mortgage payment and more than two weeks of rent.

Kansas City is also a clear case where event pricing has moved into monthly-expense territory. A group-stage ticket to Argentina versus Algeria was significantly cheaper than other matches, priced at $823, but it still represents more than half a month of rent or mortgage. The July 11 quarterfinal is priced at $1,567, higher than the city’s average mortgage payment of $1,477 and its average rent of $1,342.

In Boston, the quarterfinal on July 9 is priced at $1,333 or more than one-quarter of a monthly mortgage and around 10 days of rent. This is prompted by the city’s $850,000 median sale price, which drives a $4,298 monthly mortgage cost and a $3,885 average rent.

Philadelphia remains the most affordable housing market among the host cities, but even there, ticket prices carry real weight. The cheapest seat for Match 89 on July 4 is $1,006, versus an average mortgage payment of $1,416 and monthly rent of $1,984. Brazil vs. Haiti, the city’s most in-demand group-stage match, was priced at a minimum $855, meaning that locals had to spend over 50% of a month’s mortgage or the rough equivalent of two weeks of rent.

Seattle, already an expensive housing market, also shows meaningful ticket-to-housing comparisons. Seattle’s USA versus Australia match cost $1,096 or roughly one-quarter of the average mortgage and half a month’s rent.

Houston is somewhat lower, but still notable. The Portugal versus Uzbekistan match was priced at $802, equal to more than two weeks of average rent and about half a month’s mortgage. The city’s most expensive match overall, Match 90 on July 4, is slightly higher at $854.

San Francisco is the main outlier, since housing costs are already high there and the city got a weaker group stage. Paraguay versus Türkiye was priced at $391 or about three days of rent and 6% of the average monthly mortgage. Meanwhile, the city’s most expensive scheduled match is $682, equal to roughly six days of rent and 10% of a monthly mortgage payment.
World Cup Pricing: Locals Might Choose Between Tickets or Housing Bills
What makes the comparison notable is not just the absolute ticket price, but the fact that entry-level access to the biggest matches is now aligned with one of the most important monthly household expenses.
Once the tournament moves beyond the group stage, the cheapest available seats in several markets sit squarely in the same range as monthly rent or mortgage obligations. And because this analysis uses the lowest ticket prices available at the time of review, that means entry is effectively barred for the majority of locals.
Methodology
Ticket prices were compiled from the official FIFA World Cup 2026 portal and major ticket marketplaces, including GameTime, SeatGeek, StubHub, TicketData and Vivid Seats and include both primary and resale listings.
Prices were last verified at 7 a.m. EST on June 4, 2026.
Match opponents, dates and locations were sourced from FIFA World Cup 2026.
Median sale prices reflect PropertyShark’s proprietary data and local MLS research for April-May 2026. Mortgage estimates assume a 30-year loan at 6.5% interest with 20% down.
Rental figures come from RentCafe, a Yardi company, and reflect December 2025 data.
About PropertyShark
PropertyShark is an online real estate database and property research tool that provides building details, ownership information, comparable sales, and foreclosure data. Founded in 2003, PropertyShark serves real estate professionals and consumers in New York and other major U.S. markets.